An in-depth look at Canvas Bezier Curves
Quadratic & Cubic Bezier Curve

A bezier curve is a mathematical approach which can be used to generate smooth curves. It was first developed by the French engineer Pierre Bézier, who used it in the 1960s for perfecting the curvy bodywork of Renault cars.
The Canvas API allows us to create two kinds of bezier curves: quadratic and cubic.
Quadratic Bezier Curve
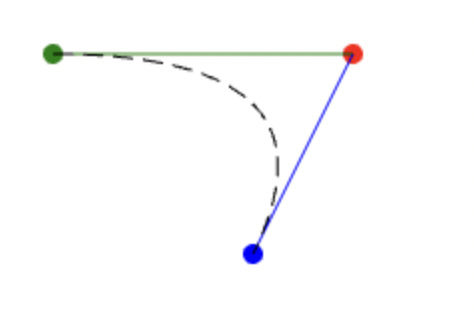
quadraticCurveTo(cx, cy, x, y)
The canvas method quadraticCurveTo() draws a curve from the current pen position (green circle) to a target position described by (x,y) (blue circle). A control point with position (cx,cy) is used to add curvature to the line.
To help us understand how the control point affects the curvature of the line, we can imagine a series of connecting lines joining the green line with the blue line. The first line joins the start of the green line at the green dot (at 0%) with the start of the blue line at the red dot (0%). More lines at different intervals join a little further along the green line (eg. 5%) with a little further along the blue line (eg. 5%). Each of these lines are tangential to the curve and so as we move from 0% to 100%, we create a smooth curve between the start point (current pen position) and the end point (x,y).
Try making some changes to the control position cx, cy and see how it affects the shape of the curve
Cubic Bezier Curve
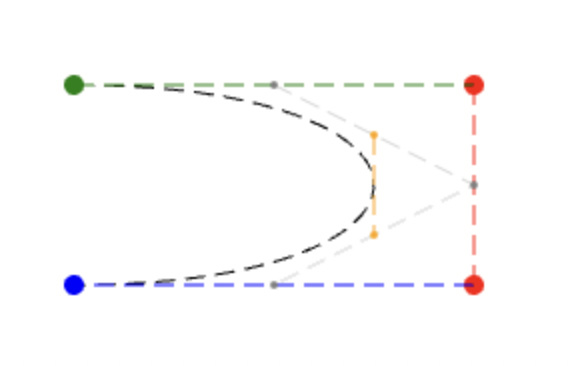
bezierCurveTo(c1x, c1y, c2x, c2y, x, y)
The canvas method bezierCurveTo() similar to quadraticCurveTo() draws a curve from the current pen position to an end position defined by (x, y). However, this time there are two control points influencing the curvature of the line (c1x,c1y,c2x,c2y).
With a Cubic Bezier curve, to understand how the two control points affect the curvature of the line we need to look at how the two lines (green & blue) and the control line (red) are actually used to create the curve. In this example, if we imagine a series of lines joining the green line with the red line and then also the red line with the blue line. If we then then join these connecting lines with a third line which is tangential to the curve, we will have created the shape of the curve.
To look at a specific point on the curve, we can just look the 50% connecting lines. First we connect the green line at the 50% position (grey dot) with the red line's 50% position (grey dot) and then connect the red line's 50% position (grey dot) with the blue line's 50% position (grey dot). We can then connect the two grey lines at their 50% position (orange dots) this will give us the tangential line (orange line). If we were to do this with all the values between 0% and 100%, this would give us the full shape of the cubic bezier curve that we observe.
Comment out the drawReferenceMarkers() call so the next steps are not confusing. Now try adjusting the control points of the cubic bezier curve so that the curve is just about touching the right side of the canvas
What happens when the c1y value is much higher than the c2y value?